Storing and Visualizing Time Series with Graphite
September 12th, 2013
WHAT IS GRAPHITE?
Graphite is a tool that does two things rather well: storing numeric time-series data (metric, value, epoch timestamp), and rendering graphs of this data on demand. Graphite time series data is an enterprise-scale monitoring tool, and was written by Chris Davis at Orbitz, and subsequently open sourced under the Apache license in 2008.
In this post, I’ll explain how to set up Graphite, and get to the “Hello World” of graphing metrics.
WHY USE GRAPHITE?
Graphite is easy to use, and within hours of setup and data collection you can graph your data so it’s meaningful to you and others. This also means you can hand it over to the business folks to build graphs that they understand. That said, people can create “bad” graphs that take a while to generate, so keep that in mind. With great power comes great responsibility!
The graphs generated by Graphite creates are static, as they are generated as images. This is adequate in most cases, but there are times when you want to explore your data in a more interactive way. Fortunately, you can pull the same data in JSON format via HTTP.
SETTING UP GRAPHITE
For the purposes of this article, I’m assuming you’re running CentOS. Currently Graphite isn’t as easy as “yum install graphite”, but the setup is straightforward.
The steps below will walk you through the install of Graphite and all its dependencies onto a new virtual machine or server.
Install EPEL repository
$ sudo rpm -Uvh http://dl.fedoraproject.org/pub/epel/6/x86_64/epel-release-6-8.noarch.rpm
$ sudo yum -y update
Install Dependencies
$ sudo yum -y install gcc.x86_64 git.x86_64 \
    python-devel pyOpenSSL python-memcached \
    bitmap bitmap-fonts python-crypto zope \
    pycairo mod_python python-ldap Django \
    django-tagging python-sqlite2 mod_wsgi
Install Python package management software
$ sudo yum -y install python-pip.noarch
Install Graphite
$ sudo pip-python install whisper carbon graphite-web
Copy the example configuration files.
$ cp /opt/graphite/conf/carbon.conf.example \
    /opt/graphite/conf/carbon.conf
$ cp /opt/graphite/conf/storage-schemas.conf.example \
    /opt/graphite/conf/storage-schemas.conf
Set up the web server
We need to configure the Django web application:
$ cp graphite.wsgi.example graphite.wsgi
Now we need to edit the following files:
/etc/httpd/conf.d/graphite-vhost.conf
In order for the django admin site media to work you must change @DJANGO_ROOT@ to be the path to your django installation, which is probably something like /usr/lib/python2.6/site-packages/django
/opt/graphite/webapp/graphite/settings.py
Add this to the end of the file, which configures the Graphite web application to use with a standalone database using SQLite.
DATABASES = {
   'default': {
        'ENGINE': 'django.db.backends.sqlite3',
        'NAME': join(STORAGE_DIR, 'graphite.db'),
        'USER': '',                  # Not used with sqlite3.
        'PASSWORD': '',              # Not used with sqlite3.
        'HOST': '',                  # Not used with sqlite3.
        'PORT': '',                  # Not used with sqlite3.
    }
}
Initial Database Creation
You must tell Django to create the database tables used by the graphite web application. Run the following commands, and keep the default settings.
$ cd /opt/graphite/webapp/graphite
$ sudo python manage.py syncdb
The following files may need permission changes depending on how you run your Apache web server. If you are running as nobody:nobody you will need to run
sudo chown nobody:nobody
on these files:
/opt/graphite/storage/log/webapp/info.log
/opt/graphite/storage/log/webapp/exception.log
/opt/graphite/storage/log/webapp
/opt/graphite/storage
/opt/graphite/storage/graphite.db
The Carbon Daemons
Graphite requires three daemons to run:
1. carbon-cache.py
This is the workhorse that collects the metrics. The metrics are initially in memory before being flushed to disk. Two config files need to be in placed before it can be run: carbon.conf and storage-schemas.conf.
2. carbon-relay.py
This provides the replication and sharding of the metric datas. It looks at carbon.conf and relay-rules.conf for its configuration.
3. carbon-aggregator.py
This is used in front of carbon-cache.py to buffer and aggregate metrics before reporting them to the whisper database. This is useful for when you don’t need fine grained data, and it reduces I/O.
Full details about the daemons can be found on the Graphite web site as well as information about whisper.
A Graphite Hello World
To get things up and running, first copy the example configuration files.
cp /opt/graphite/conf/carbon.conf.example /opt/graphite/conf/carbon.conf
cp /opt/graphite/conf/storage-schemas.conf.example /opt/graphite/conf/storage-schemas.conf
First start up the carbon cache (I’m going to assume your web server is up and running):
$ sudo /usr/bin/python /opt/graphite/bin/carbon-cache.py \
    --debug start
Using –debug will give you a feel for how Graphite works. Now, let’s send some data to it.
Data sent to Graphite is in the form of three values:
- metric name
- metric value
- epoch timestamp
This little script generates some dummy data every 60 seconds, run it from a different terminal window.
for i in {1..20}; do echo metric.example `number=$RANDOM; let "number %= 100"; echo $number` `date +%s` | nc YOUR_SERVER_IP 2003; sleep 60; done
What we are doing is creating a metric called “metric.example” and we are setting a value from 1-100 and sending it to the Graphite server on port 2003 (the port carbon cache is running on).
Now, as data flows in, you should be seeing things happen on the terminal window that’s running carbon cache, thanks to the debug flag.
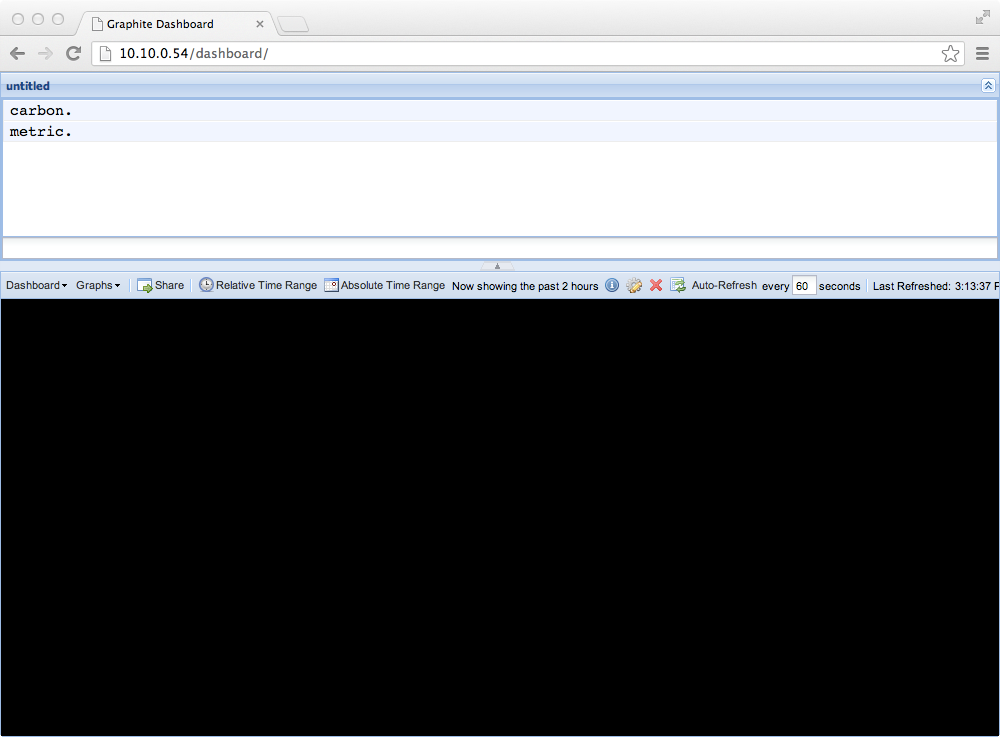
Next, let’s create a simple graph. Visit the Graphite UI in your browser, http://10.10.0.1/dashboard/, substituting the hostname of your server. You should see something like this:
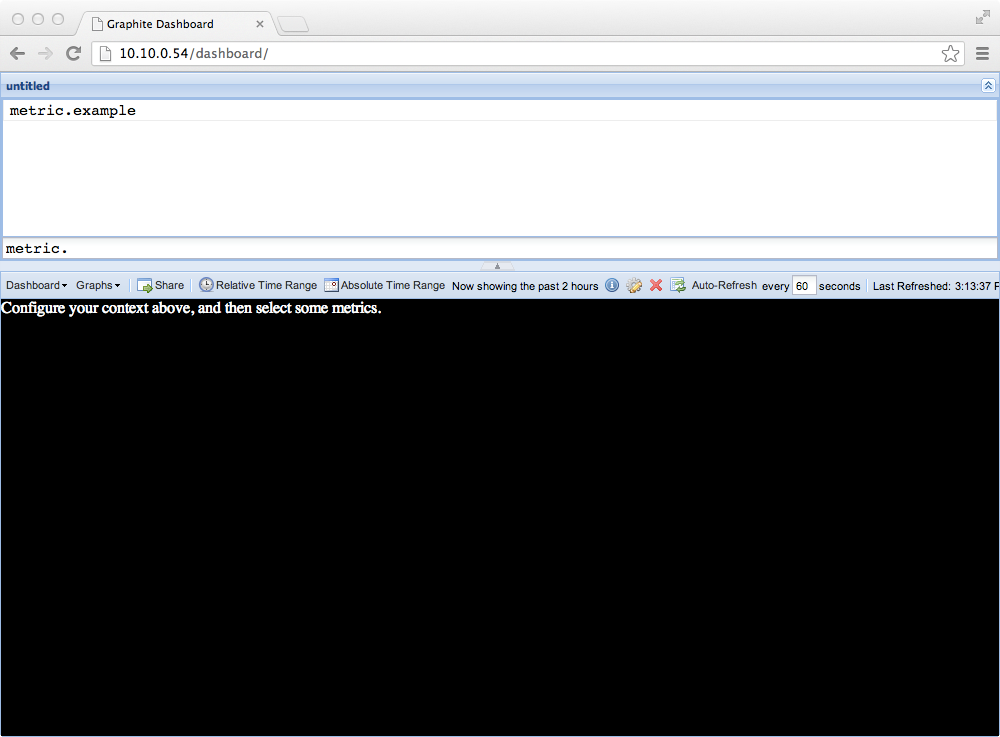
Click on “metric”, and you should see this:
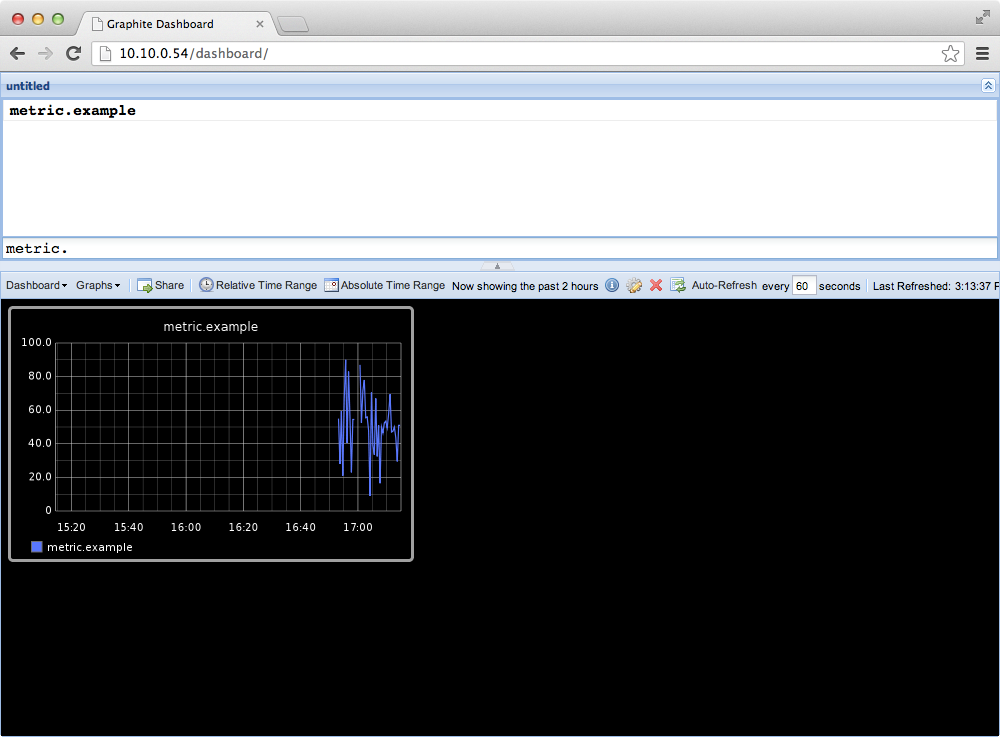
Now click through to “metric.example” and you will see a chart of the example data.
Congratulations! You have now created your first graph. All graphs in Graphite have a direct URL, so you don’t need to go via the dashboards. You can group them into a web page and display them the way you like.
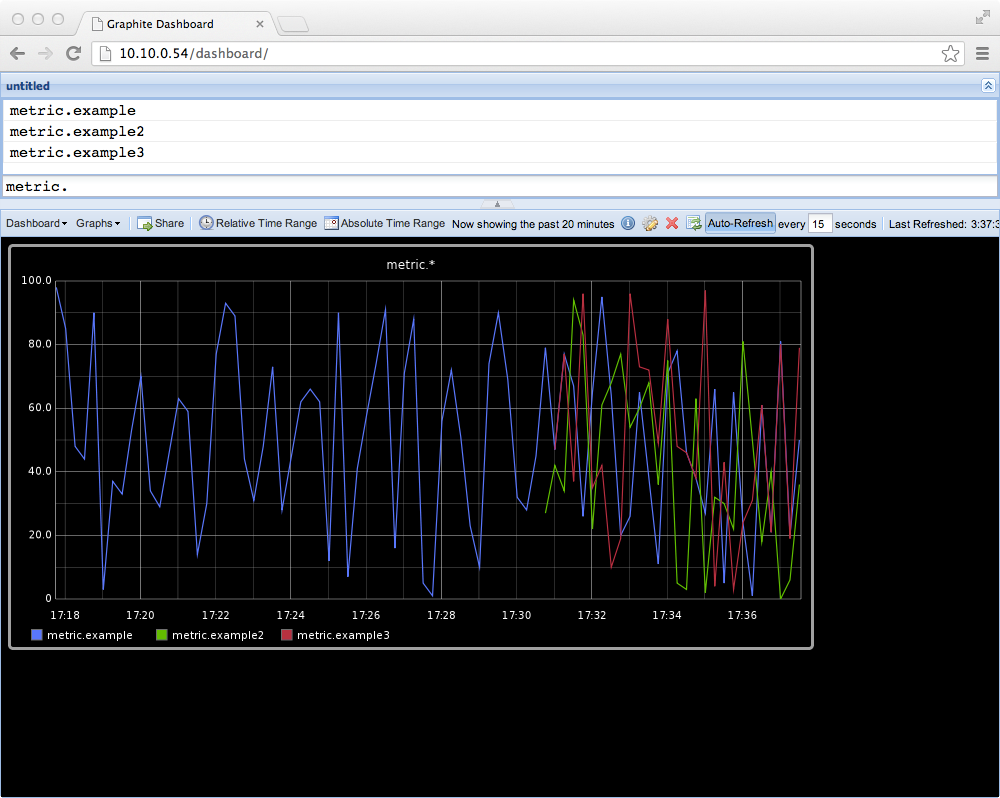
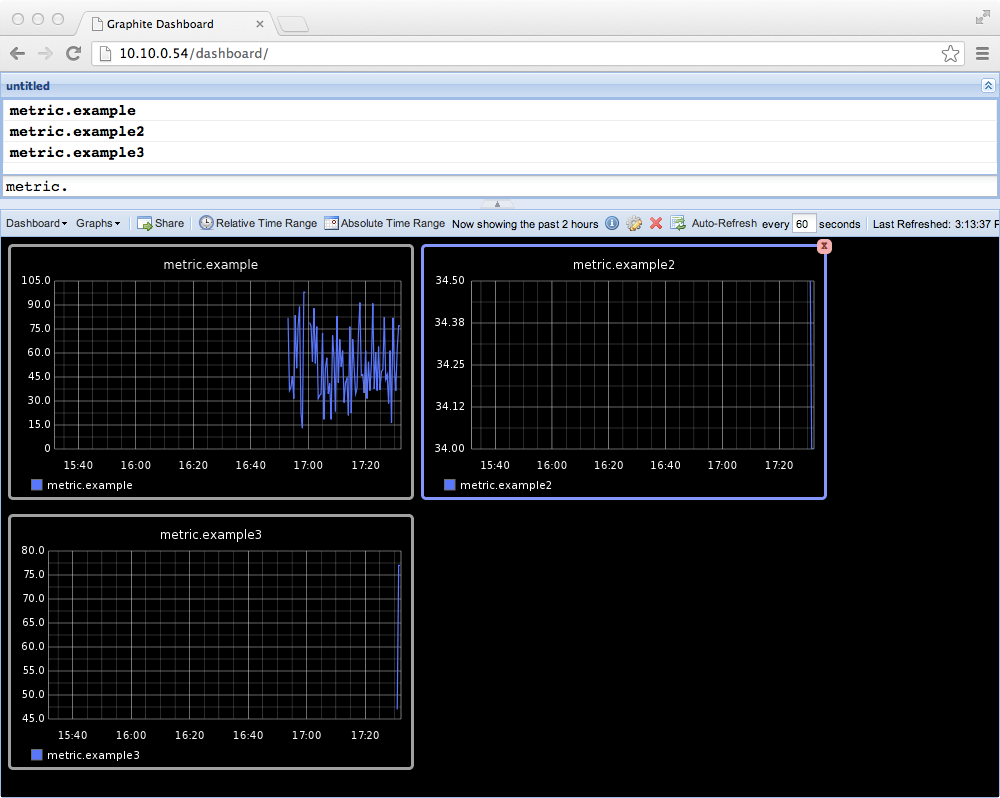
As you can see, metric names have a dot notation. As we used “metric.example”, we can add more examples under “metric.” like this:
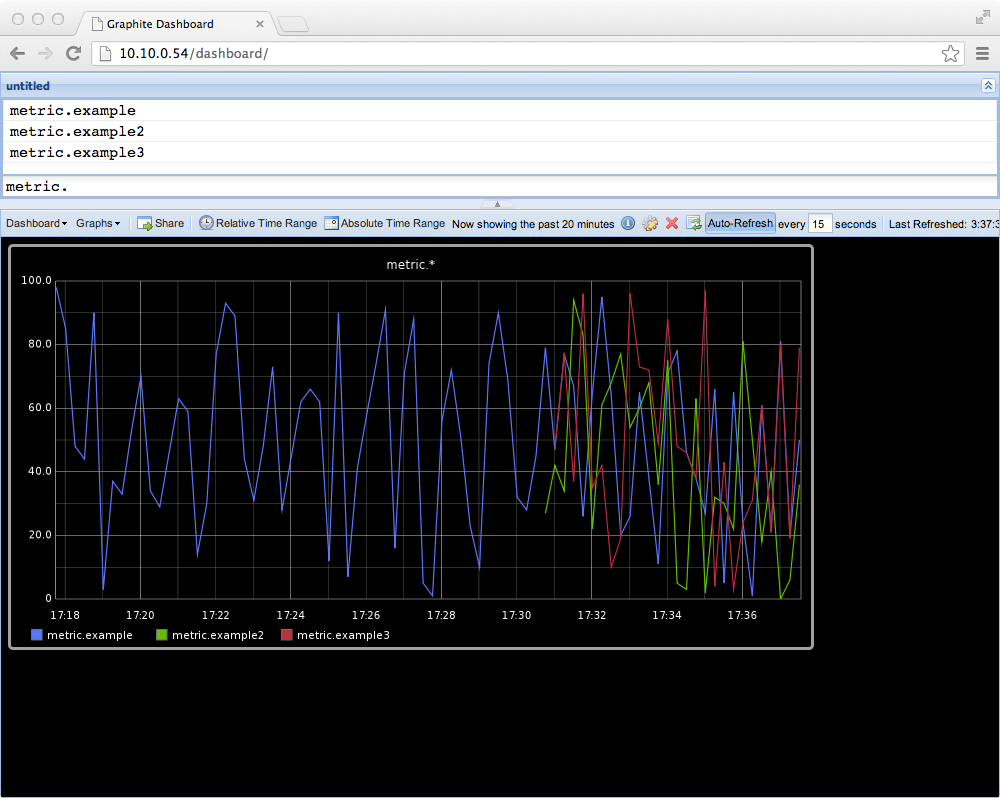
You see three separate graphs. Because these metrics are related, it would be nice to see them on a single chart. Using dot notation we can do this by using the wild card character *. So we can look at these by selecting “metric.*” like this:
JSON output
As I said earlier, you can get the Graphite data back out in JSON format. It’s all based on the URL, so to get the above data set in JSON try:
http://10.10.0.54/render?from=-5minutes&until=now&target=metric.*&format=json
The data you get will look a bit like this:
[{"target": "metric.example", "datapoints": [[21.0, 1376001405], [81.0, 1376001420], [20.0, 1376001435], [50.0, 1376001450], [9.0, 1376001465], [16.0, 1376001480], [42.0, 1376001495], [19.0, 1376001510], [96.0, 1376001525], [26.0, 1376001540], [86.0, 1376001555], [55.0, 1376001570], [85.0, 1376001585], [45.0, 1376001600], [4.0, 1376001615], [81.0, 1376001630], [11.0, 1376001645], [1.0, 1376001660], [61.0, 1376001675], [99.0, 1376001690]]},
{"target": "metric.example2", "datapoints": [[40.0, 1376001405], [0.0, 1376001420], [6.0, 1376001435], [36.0, 1376001450], [5.0, 1376001465], [90.0, 1376001480], [46.0, 1376001495], [76.0, 1376001510], [83.0, 1376001525], [13.0, 1376001540], [73.0, 1376001555], [12.0, 1376001570], [71.0, 1376001585], [31.0, 1376001600], [91.0, 1376001615], [68.0, 1376001630], [98.0, 1376001645], [20.0, 1376001660], [79.0, 1376001675], [86.0, 1376001690]]},
{"target": "metric.example3", "datapoints": [[21.0, 1376001405], [80.0, 1376001420], [19.0, 1376001435], [79.0, 1376001450], [47.0, 1376001465], [95.0, 1376001480], [89.0, 1376001495], [57.0, 1376001510], [26.0, 1376001525], [56.0, 1376001540], [15.0, 1376001555], [54.0, 1376001570], [84.0, 1376001585], [44.0, 1376001600], [34.0, 1376001615], [11.0, 1376001630], [41.0, 1376001645], [0.0, 1376001660], [60.0, 1376001675], [29.0, 1376001690]]}]
This output is all the metric info for the last five minutes. The data points are the metric values and the epoch timestamp. Notice is that the timestamps are in 15 second intervals. This is because for this example I added a new pattern to the storage-schema.conf for any metric starting with “metric”, indicating how we want to store and retain data.
[metric.example]
pattern = ^metric\.
retentions = 15s:1d
The Graphite documentation has full information on what everything means, but to give you an idea these directives control how much data Graphite stores, and in which buckets for how long. So 15s:1d means store 15 second buckets of data for one day. If you look at the file system, you will see directories and files for each metric.
Congratulations! Now you’ve got Graphite up and running, experiment with sending some real world data to it.
Header image by Justin Grimes. Used under CC BY-SA 2.0.


