Analyzing Sentiment in Caltrain Tweets
As a first step to using Twitter activity as one of the data sources for train prediction, we start with a simple question: How do Twitter users currently feel about Caltrain?
As a first step to using Twitter activity as one of the data sources for train prediction, we start with a simple question: How do Twitter users currently feel about Caltrain?
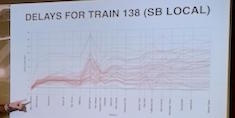
In this post, we will explore some aspects of the train delay data we’ve been collecting from the Caltrain API.
In this post, Matt talks about using TensorFlow to detect true and false positives in our Caltrain work.

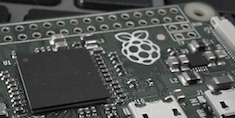
In this post, we discuss our Raspberry Pi streaming video analysis software, which we use to better predict Caltrain delays.

In this post, we use a Jupyter Notebook go over the steps for creating a proof of concept for the image processing piece of our Caltrain work.
In this post we’ll start looking at the nuts and bolts of making our Caltrain work possible: image processing, video analysis, and image recognition.
On May 6th, SVDS hosted an Open Data Science Conference (ODSC) Meetup in our Mountain View headquarters. Data Engineer Harrison Mebane and Data Scientist Christian Perez presented on our Caltrain project.

We believe there are clearly some compelling value propositions that come from integrating the visibility from the IoT into applications that help understand and manage the state of complex systems. With the internet of things, the more things, really, the merrier.
In this post, we will explore some aspects of the train delay data we’ve been collecting from the Caltrain API over the past few months. The goal is to get our heads into the data before setting off on building a prediction model.