Brain Monitoring with Kafka, OpenTSDB, and Grafana
July 14th, 2016
Here at SVDS, we’re a brainy bunch. So we were excited when Confluent announced their inaugural Kafka Hackathon. It was a great opportunity to take our passion for data science and engineering, and apply it to neuroscience.
We wondered, “Wouldn’t it be cool to monitor our brain wave activity? And process those signals to control devices like home appliances, light switches, TV’s, and drones?“ We didn’t end up having enough time to implement mind control of any IoT devices during the 2-hour hackathon. However, we did win 2nd place with our project: streaming brainwave EEG data through Kafka’s new Streams API, storing the data on OpenTSDB with Kafka’s Connect API, and finally visualizing the time series with Grafana. In this post, we’ll give a quick overview of how we did all this, reveal the usage of Confluent’s unit testing utilities, and, as a bonus, we’ll show how it’s done in Scala.
Please note that this is not meant to be a production-ready application. But, we hope readers will learn more about Kafka and we welcome contributions to the source code for those who wish to further develop it.
Installation Requirements
All source code for our demo application can be found in our GitHub repository.
We used the Emotiv Insight to collect brainwave data, but the more powerful Epoc+ model should work, too. For those who don’t have access to the device, a pre-recorded data sample CSV file is included in our GitHub repository, and you may skip ahead to the “Architecture” section.
In order to collect the raw data from the device, you must install Emotiv’s Premium SDK which, unfortunately, isn’t free. We’ve tested our application on Mac OS X, so our instructions henceforth will reference that operating system.
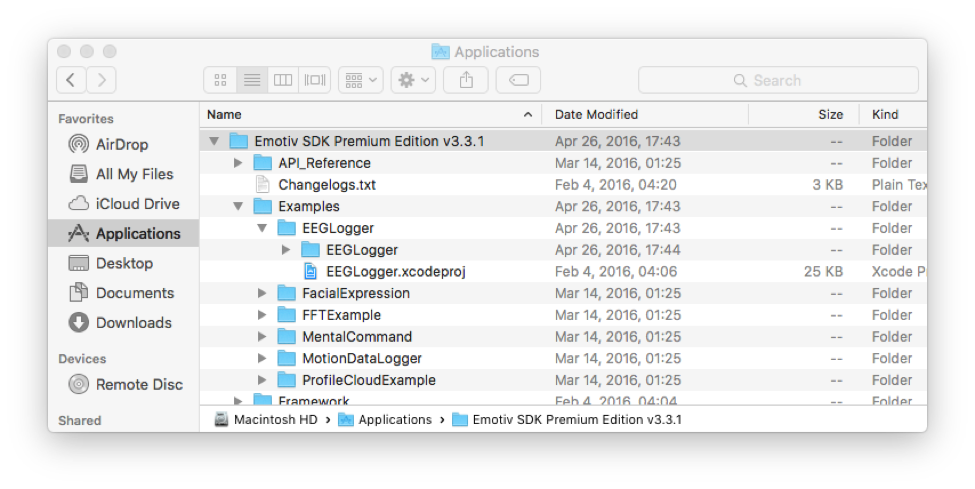
Once you’ve installed the Premium SDK, open their “EEGLogger.xcodeproj” example application.
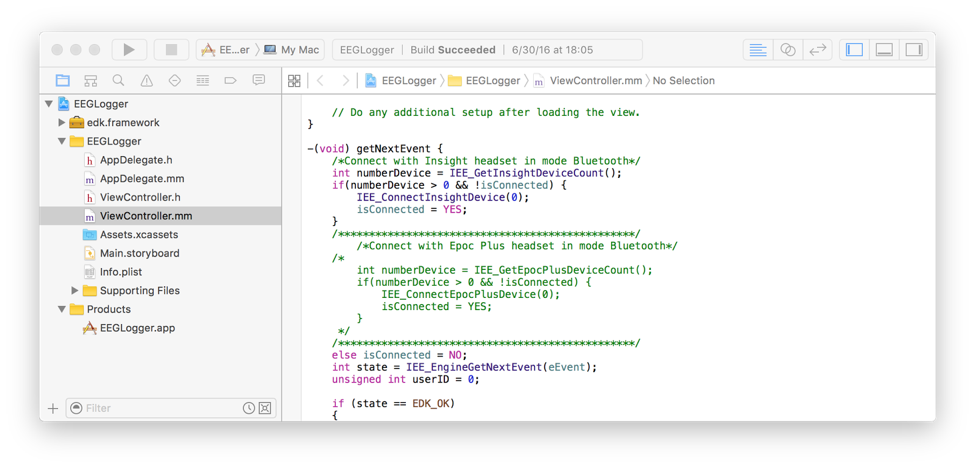
Assuming you have Xcode installed, the example application will open in Xcode. If you have the Insight instead of the Epoc+, you will need to uncomment a few lines in their Objective-C code. Go to the “getNextEvent” method in the “ViewController.mm” file and uncomment the lines of code for the Insight, and comment out the lines of code for the Epoc+.
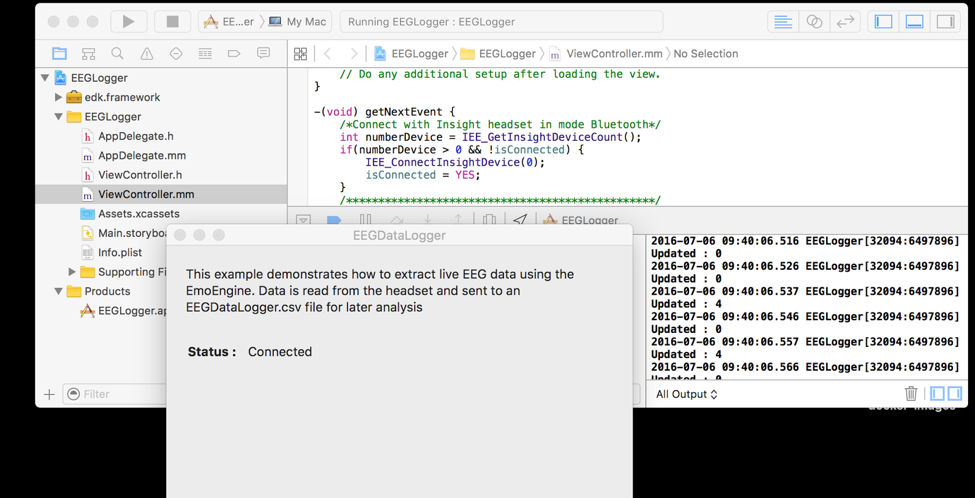
Next, save your changes and press the “play” button in Xcode to run their example app on your Mac. Power on your Insight or Epoc+ headset and the example app will soon indicate that it’s connected (via Bluetooth). Once the Bluetooth connection to the headset is established, you’ll see log output in Xcode. That’s your cue to inspect the raw EEG output in the generated CSV file found in your Mac at the path “~/Library/Developer/Xcode/DerivedData/EEGLogger-*/Build/Products/Debug/EEGDataLogger.csv”.
Press the “stop” button in Xcode for now.
Architecture
To give you a high level overview of the system, the steps of the data flow are:
- Raw data from the Emotiv headset is read via Bluetooth by their sample Mac app and appended to a local CSV file.
- We run “tail -f” on the CSV file and pipe the output to Kafka’s console producer into the topic named “sensors.”
- Our main demo Kafka Streams application reads each line of the CSV input as a message from the “sensors” topic and transforms them into Avro messages for output to the “eeg” topic. We’ll delve into the details of the code later in this blog post.
- We also wrote a Kafka sink connector for OpenTSDB, which will take the Avro messages from “eeg” topic and save the data into OpenTSDB. We’ll also describe the code for the sink connector in more detail later in this blog post.
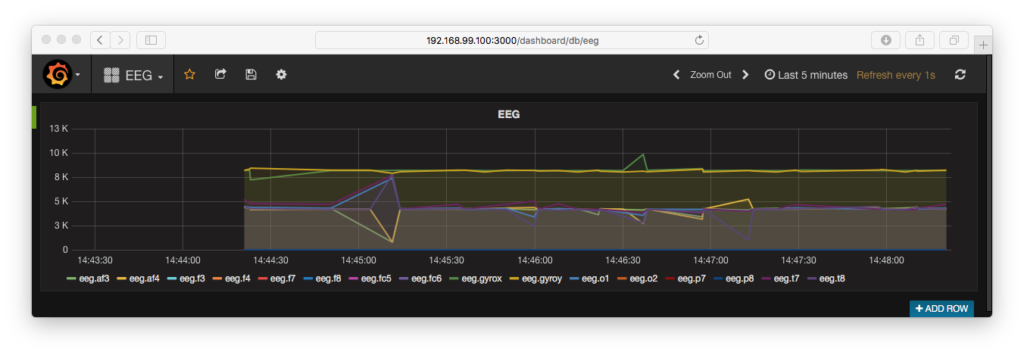
- Grafana will regularly poll OpenTSDB for new data and display the EEG readings as a line graph.
Note that, in a production-ready system, brain EEG data from many users would perhaps be streamed from Bluetooth to each user’s mobile app that in turn sends the data into a data collection service in your cloud infrastructure. Also note that, for simplicity’s sake, we did not define partition keys for any of the Kafka topics in this demo.
Running the Demo
Before running the demo, you’ll need git, scala, sbt and Docker (including docker-machine & docker-compose) installed. If you’re running Mac OS X, you can install them with Homebrew.
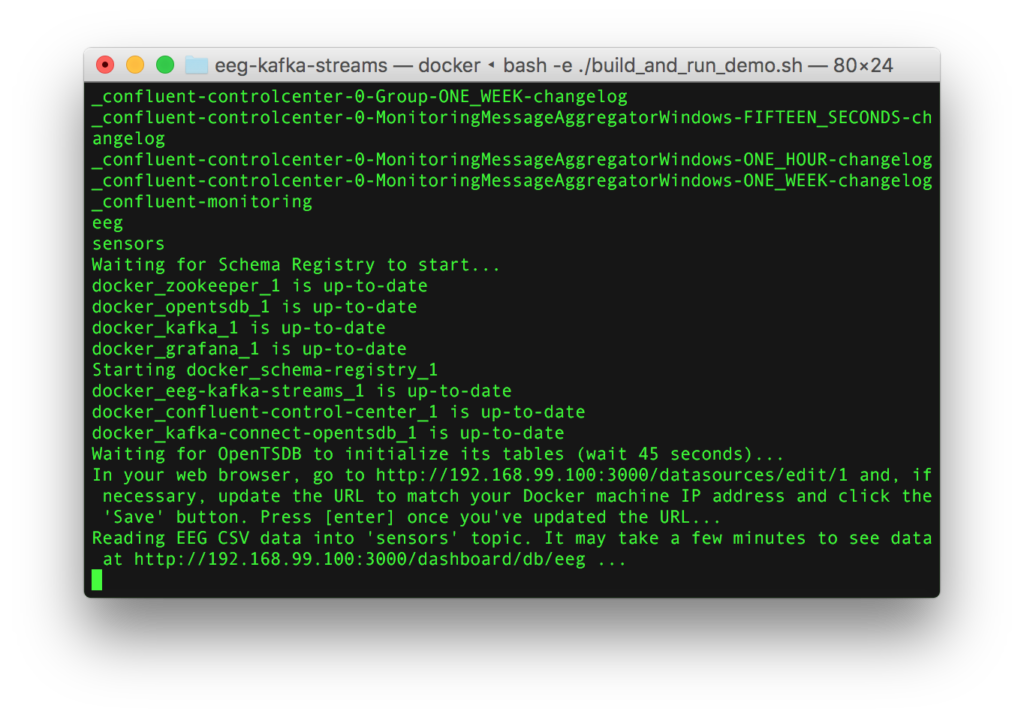
To run the demo, clone our GitHub repository so that you have a copy of the source code on your computer, and follow the instructions in the README, which will ask you to run the “build_and_run_demo.sh” shell script. The script will handle everything, but keep an eye on its output as it runs. By default, the script plays the pre-recorded data in a loop. If you wish to see the raw data from your Emotiv headset, run the script with the “-e” flag.
- If your Docker machine isn’t already up and running, you may need to start it and re-initialize Docker-specific environment variables.
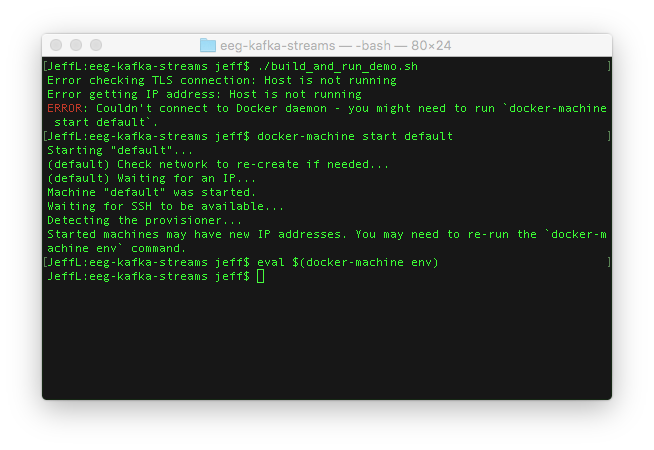
- The shell script will clone source code repositories from GitHub and build JAR files.
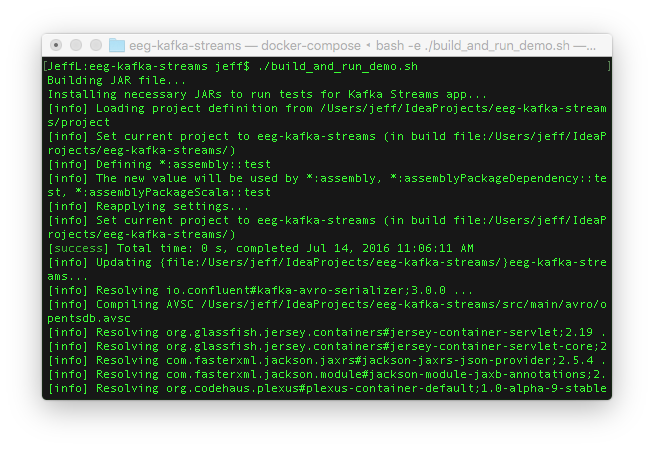
- Then it’ll download Docker images.
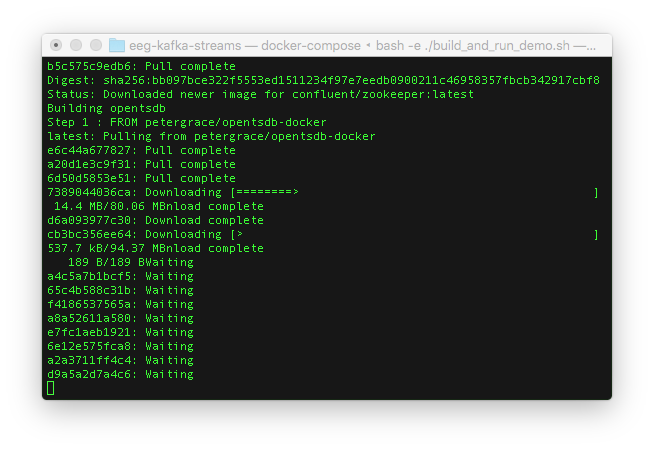
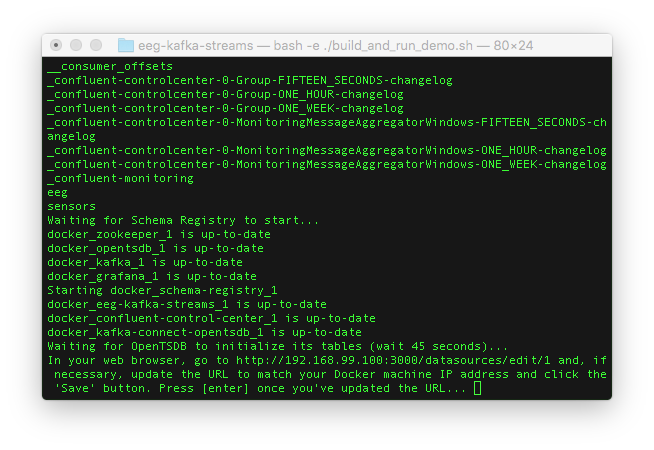
- After the Docker images are downloaded, the Docker containers will be spawned on your machine and Kafka topics will be created. You should see that the “sensors” and “eeg” topics are available.
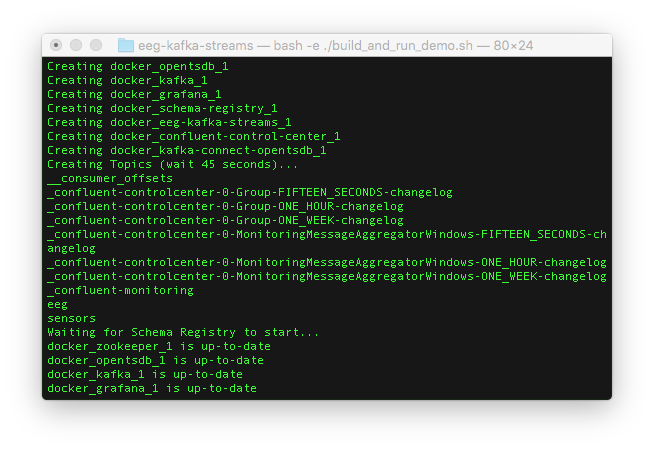
- You’ll be asked to open the URL to your Docker container for Grafana.
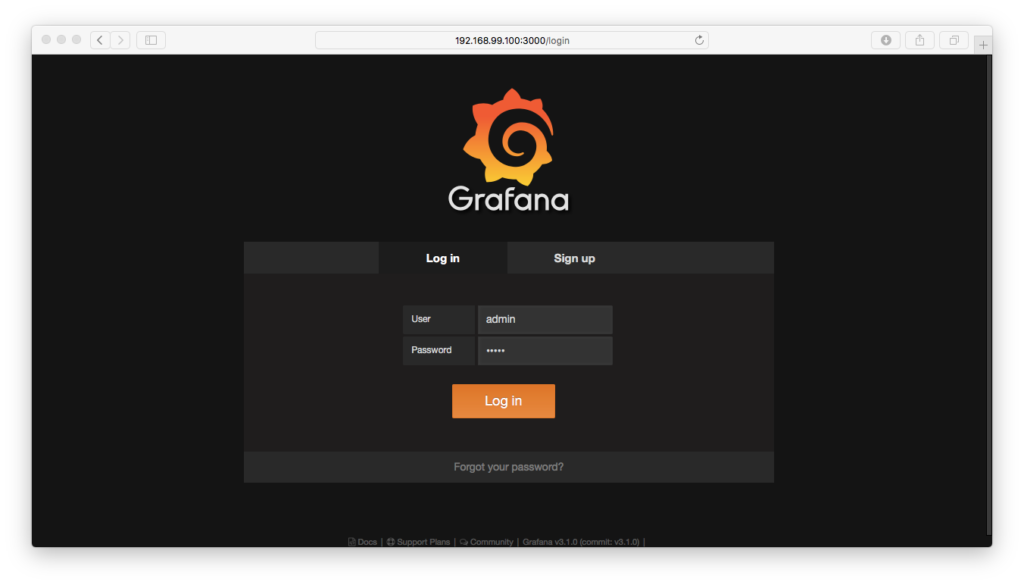
- You’ll need to login with “admin” as the username and “admin” as the password.
- Then you’ll be redirected to the administrative web page for configuring the database connection to OpenTSDB. The only thing you might need to change is the IP address in the URL text input field. The IP address is your Docker machine’s IP address and should match the one in your web browser. Here in the screenshot below, my Docker IP address is 192.168.99.100, so there is nothing for me to update.
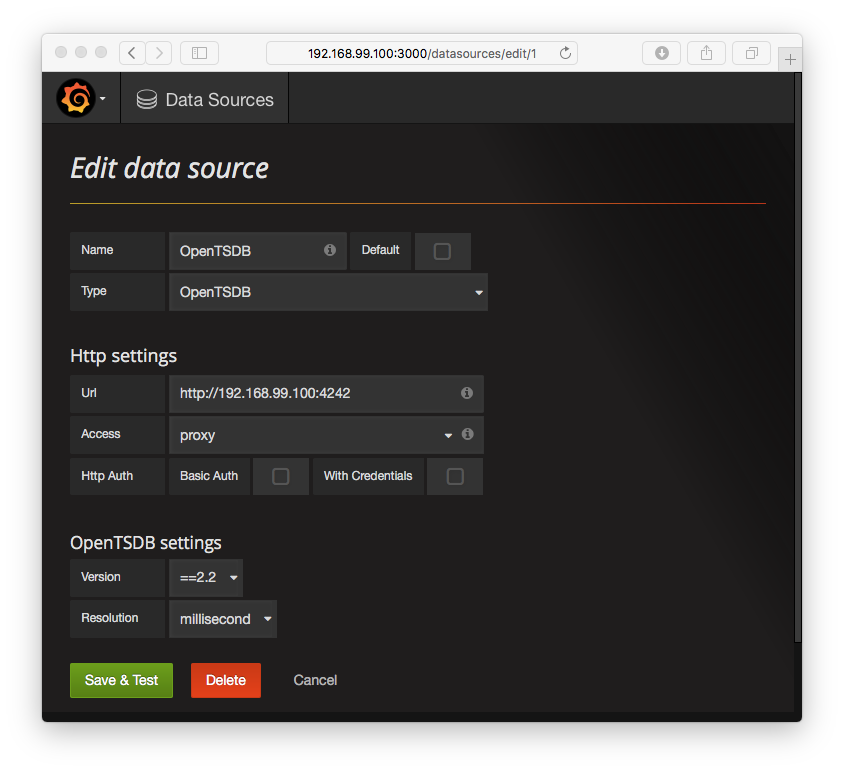
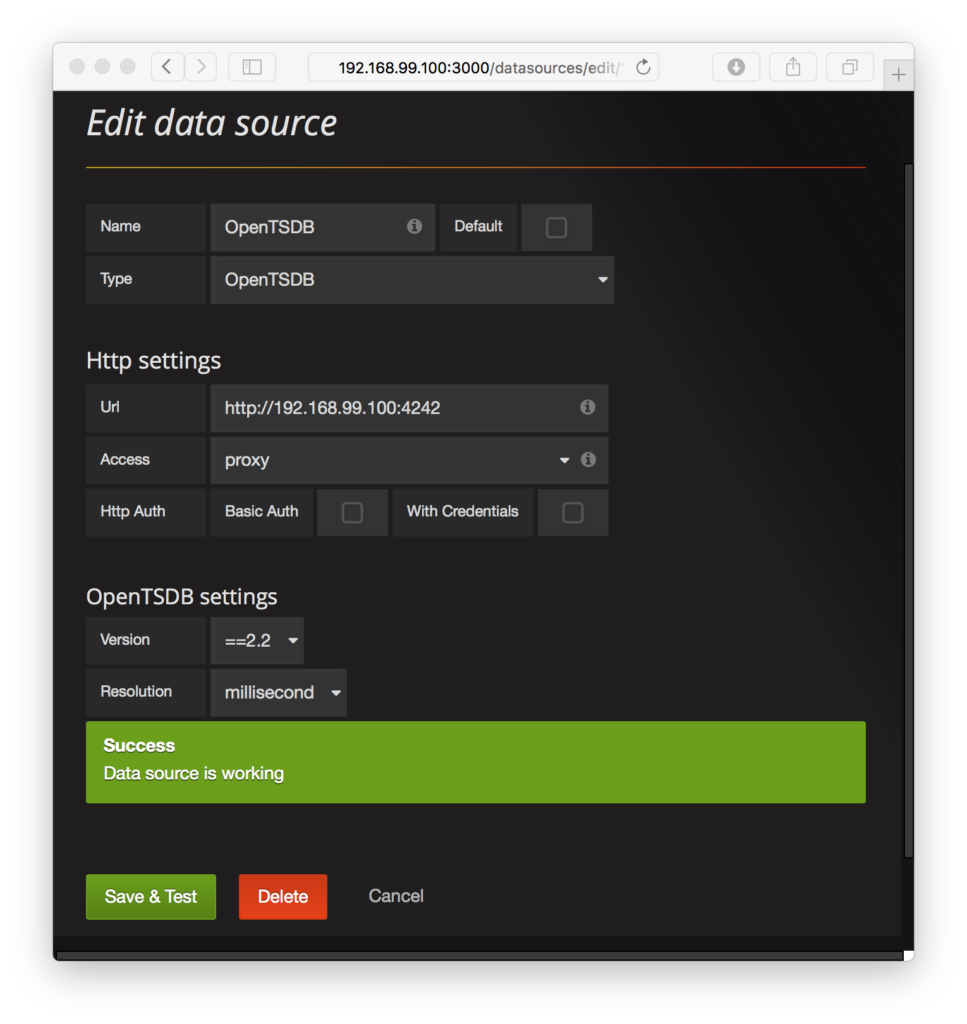
- Click the green “Save & Test” button and you should see a success dialog indicating that Grafana can indeed connect to OpenTSDB.
- Go back to your terminal and press the “enter” key to start streaming the example EEG data through the system. The URL to your EEG dashboard on Grafana will appear.
- Finally, go to the URL, and you’ll see the brain wave data in your web browser.
Source code details
We’ll highlight key pieces of information we had to figure out, in many cases by looking at the Confluent’s source code since they weren’t well-publicized in either Kafka’s or Confluent’s documentation.
Streams application
Importing libraries
To use Confluent’s unit testing utility classes, you’ll need to build the a couple of JAR files and install them in your local Maven repository since they are not yet (at the time of this writing) published in any public Maven repository.
In the build.sbt file, the unit testing utility classes are referenced in the “libraryDependencies” section with either “test” and/or “test” classifier “tests” for each relevant library. Your local Maven repository is referenced in the “resolvers” section of the build.sbt file.
Installing the JAR files into your local Maven repository requires cloning a couple of Confluent’s GitHub repositories and running the “mvn install” command, which is handled in the “test_prep.sh” shell script. Note that we’re using a forked version of Confluent’s “examples” GitHub repository because we needed additional Maven configuration settings to build a JAR file of the test utility classes.
Avro class generation
Avro is used to convert the CSV input text and serialize it into a compact binary format. We import sbt-avrohugger in “build.sbt” and “project/plugins.sbt” for auto-generating a Scala case class from the Avro schema definition, which represents an OpenTSDB record. The Avro schema follows OpenTSDB’s data specification—metric name, timestamp, measurement value, and a key-value map of tags (assumed to be strings). The generated class is used in the Streams application during conversion from a CSV line to Avro messages in the “eeg” output Kafka topic, where the schema of the messages are enforced by Confluent’s schema registry.
Unit testing
Note the use of the “EmbeddedSingleNodeKafkaCluster” and “IntegrationTestUtils” classes in the test suite. Those are the utility classes we needed to import from Confluent’s “example” source code repository earlier. For testability, the Streams application’s topology logic is wrapped in the “buildAndStartStreamingTopology” method.
Command line options
After seeing a few examples in its documentation, we found Scopt to be a convenient Scala library for defining command line options. The first block of code in the main Streams application uses Scopt to define the command line parameters.
Different input and output serdes
The default Kafka message key and value are assumed to be Strings, hence the setting of the StreamsConfig key and value serdes (serializers/de-serializers) to the String serde. However, since we want to output Avro messages to the “eeg” topic, we override the outbound serde when the “.to()” method is called.
Avro serde and schema registry
Serializing and de-serializing Avro requires Confluent’s KafkaAvroSerializer and KafkaAvroDeserializer classes. Their constructors require the schema registry client as a parameter, so we instantiate an instance of the CachedSchemaRegistryClient class.
EEG CSV format and downsampling
The data originating from the EEG CSV file includes measurements from each sensor of the headset. Each of those sensor readings are converted into an Avro object representing an OpenTSDB record with the name of the sensor included in the OpenTSDB metric name.
Although there is a CSV column for original event’s timestamp, it’s not a Unix timestamp. So the system processing time (i.e., “System.currentTimeMillis()”) is used for simplicity’s sake.
The very first column of the CSV is the “counter”, which cycles through the numbers from 0 through 128. We downsample by filtering on the counter since the demo Docker cluster setup can’t handle the full volume of the data stream.
Sink connector
This section highlights some key points in our sink connector source code. We’ll mention what was needed to define custom configuration properties for connecting to a particular OpenTSDB host as well as settings to the OpenTSDB server itself.
The “taskConfigs” method
When defining a Kafka Connector, each task created by the connector receives a configuration. Even if your connector doesn’t have any task configuration settings, the “taskConfigs” method must return a list that contains at least one element, even if it’s an empty configuration Map class instance, in order for tasks to be instantiated. Otherwise, your connector won’t create any tasks and no data will be written to OpenTSDB.
Defining config settings for OpenTSDB host & port
As you may have inferred from the Docker file, the sink connector settings are in a properties file that are read when the Kafka Connect worker starts. We’ve defined the property keys for the OpenTSDB host and port, plus their default values, in the “OpenTsdbConnectorConfig” class. The default values are overridden in the properties file to match the host and port defined in the main docker-compose.yml configuration file. The property settings are propagated to each Kafka Connect task via the “props” parameter in the overridden “start()” method of the sink task class.
Writing to OpenTSDB
OpenTSDB’s documentation recommends inserting records through its HTTP API. We used the Play framework’s WS API to send HTTP POST requests containing data read from the Avro messages in the “eeg” Kafka topic. Currently, the task class has no error handling of cases when the HTTP request returns an erroneous response or times out.
OpenTSDB configuration changes needed for Connector
There are a couple of configuration settings in the OpenTSDB server itself that we needed to override. Both are set to true.
tsd.storage.fix_duplicates
This needs to be set to “true” because different measurements from the same sensor may have the same timestamp assigned during processing time.
tsd.http.request.enable_chunked
Chunk support should be enabled so that large batches of new data points will be processed if the large HTTP request is broken up into smaller packets.
Kafka Connect Standalone & Distributed Properties
In the Kafka Connect worker’s Docker file, note that the CLASSPATH environment variable must be set in order for the Kafka Connect worker to find the OpenTSDB connector JAR file.
Also, it includes property files for both standalone and distributed modes, but only standalone mode is enabled in the Docker image.
Grafana
Lastly, the visualization settings and connection settings to OpenTSDB are pre-loaded in its Docker container image.
Conclusion
We’ve given a whirlwind tour of our brain EEG streaming application, highlighting the usage of Confluent’s unit testing utility classes and many other components in the system. I’d like to thank my SVDS colleagues Matt Mollison, Matt Rubashkin, and Ming Tsai, who were my teammates in the Kafka Hackathon.
Would you like to see further developments? Please let us know in the comments below. Your feedback and suggestions for improvement are welcome.


