
Better Know the Districts
April 3rd, 2015
For more information on this project, explore with the interactive visualization.
In 1787, the Founding Fathers of the United States came together and amended the Articles of Confederation to create the House of Representatives. Their intention was to give America a governing body that would represent the opinions and ideals of the people on a per capita basis (in contrast to the Senate, where each state had an equal number of representatives). More than two centuries later, Congress has given us many reasons to question whether it actually represents us, including repeated government shutdowns and failure to act on the pressing problems of the day.
One might reasonably judge how well the congress reflects the views of the citizenry by examining the proportion of those citizens who think congress is doing a good job. On this front the news is not good: the average approval rating of the 113th Congress over polls taken in 2014 was about 15%. Despite this fact, the incumbent reelection rate was well above 90%. To a team of data scientists who often analyze customer behavior, this is surprising indeed. We expect brands who disappoint their customers to lose business over time, yet that does not seem to happen in modern politics. What can explain this dissonance?
One of the House of Representatives’ most important powers and responsibilities is that of the purse—the exclusive power to initiate bills for raising revenue. Here the news is also grim. The government has shut down 12 times since 1981 due to Congress’s inability to pass budgets. During the government shutdown in October 2013, comedian Jon Stewart offered a hypothesis for the cause of government gridlock and shutdowns: gerrymandering. Stewart’s hypothesis is essentially that gerrymandering leads to very partisan congressional districts, who in turn elect very partisan representatives. These representatives refuse to compromise, leading to gridlock and shutdowns.
How has the method for defining congressional districts impacted the membership of the House? Does it lead to gridlock? Who does Congress really represent? We wanted to take a deeper look.
Does the House Represent the People?
While the intent may have been for the House of Representatives to represent the people, its modern incarnation clearly does not mirror the self-identified affiliation of eligible voters in the United States. Over the last decade, about 40% of eligible voters identify as independent, with the remaining splitting between the major political parties: 30% Republican and 30% Democrat. However, there is not a single independent representative in the House and the Republican party has a significant majority of representatives.
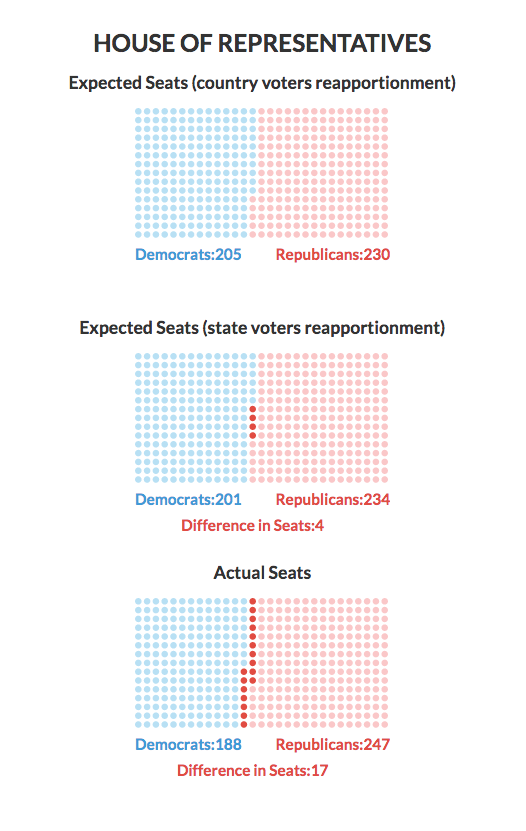
Most eligible voters don’t vote, but does this account for the discrepancy? In 2014, approximately 51% of the voters gave their preference to Republican party candidates, while 46% voted for Democrats. The remaining 3% voted for third-party candidates. If we were to apportion congressional seats based on voting behavior at the national level, congress would look like what is shown at the top of Figure 1 (Congressional Seats Reapportionment, 2014), with 230 Republicans and 205 Democrats.1
However, congressional seats are actually assigned based on state populations using the method of equal proportions. So we might naively expect the distribution of seats to reflect how people vote within each state. The middle graph shows the result obtained using the method of equal proportions on state-level voter populations:2 234 Republicans and 201 Democrats, or a difference of 4 seats compared to how we would expect Congress to look based on national voting behavior.
The actual distribution of seats is shown at the bottom. There’s a large discrepancy in seat distribution compared to the expected versions above, which translates into a real advantage when it comes to congressional action in the House of Representatives.
How did things get this way? Let’s return to Stewart’s hypothesis.
Gerrymandering
Gerrymandering is the act of strategically redrawing districts to create an electoral advantage for one party and, in so doing, disenfranchising the other. The name comes from the 1812 Massachusetts governor, Elbridge Gerry, who signed a bill redrawing the state into districts that benefited his party. According to the Boston Gazette, one of these resembled a salamander in shape, and the portmanteau was born.
This was possible because in Massachusetts at the time (and now), congressional districts were drawn by the party in control of the state government. While not all states put partisan interests in control of drawing districts, it’s fairly common practice across the US. The result is congressional delegations that don’t represent the populations of their states—not to mention some pretty strangely shaped districts.
Redistricting
The method of dividing a state into districts after each official federal census, or redistricting, is determined by each state and not by the federal government. Redistricting can be contentious, particularly when one party controls the redistricting process. In some states, including California and Arizona, the drawing of district boundaries is delegated to a bipartisan independent commission. In others, such as Illinois and Florida, redistricting is controlled by the state legislature. Control over redistricting can be used to create and protect a party majority in the House delegation.
If one party is in control of redistricting, they can draw district borders to create specific distributions of voters, leading to electoral outcomes advantageous to that party. This is known as “packing and cracking.” By packing voters from the opposing party together into a few strategically drawn districts, and cracking (or diluting) the remaining opposing voters across the rest of the districts, the party in control can concede a few lopsided wins to their opponents, but create a greater number of more easily won districts for themselves. Put all of your opponents into a few districts, while leaving yourself a comfortable majority in the remaining districts, and you can give a state with an evenly distributed population a lopsided congressional delegation.3
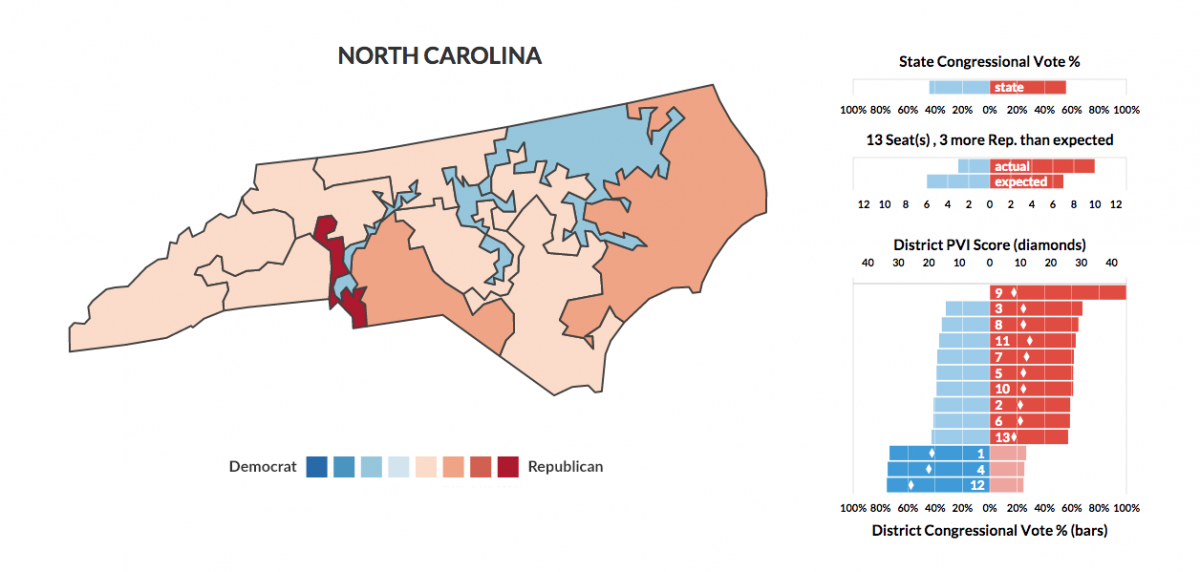
Left: Districts are colored by the percentage of voters per party.
Right upper: Voter distribution by district.
Right lower: Actual and expected seats based on state voting percentages.
For example, in North Carolina (Figure 2)4 the 2014 votes were somewhat in favor of the GOP: 55% to 44%. With that distribution we would expect seven of their 13 seats to go to the Republicans and the other six to go to the Democrats. In reality, Democrats have only three seats. Comparing the distribution of Democratic votes in Districts 1, 4, and 12 to the rest of the state (Figure 2, right-side bar graph), this seems to be the result of packing and cracking. Maybe not so coincidentally, Republicans are in control of redistricting in NC.
Compactness
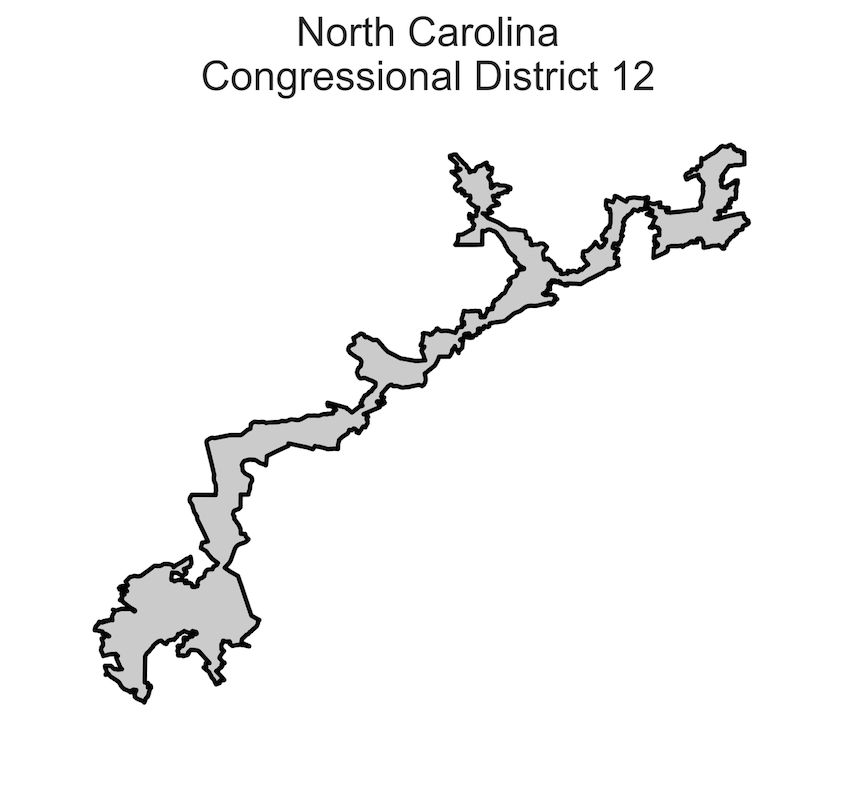 It seems clear that districts are drawn to achieve specific distributions of voters in those districts, but how might we quantify that and distinguish these districts from ones drawn for other reasons? One feature to notice about some of the districts in North Carolina is their labyrinthine shape, harkening back to the origins of the term Gerrymandering. Quantifying spatial information about districts may provide insight into the method of gerrymandering, particularly under the hypothesis that packing involves connecting politically similar but geographically unrelated groups into a few districts.
 We can use the notion of compactness to quantify the shapes of districts, a metric of how tightly the area of a shape is packed into its boundary. Simplistically, one can think of it as a ratio of the area to the perimeter. The formula was first proposed by E.P. Cox as a measure to estimate the roundness of sand grains and later extended to congressional districts by Polsby and Popper.5 The formula describes compactness (
C) as the ratio of the district’s actual area (A) to the area of a circle with the same circumference as perimeter (P) of a given district:
![]()
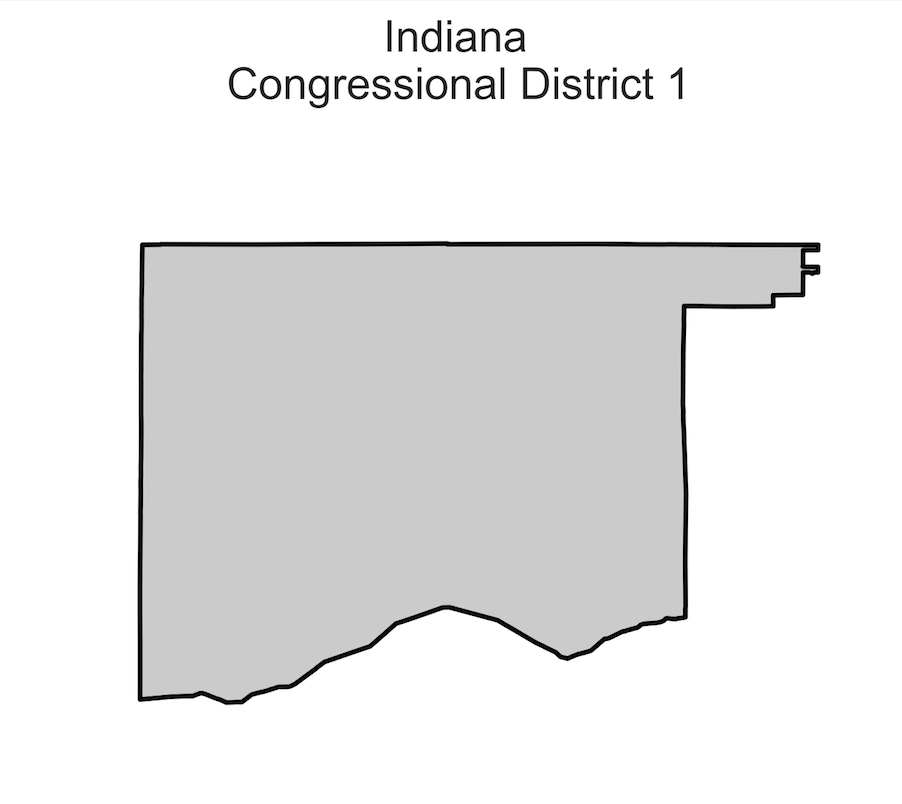
Based on this measure, a district with a very squiggly border will be less compact, and one with a more rectangular border will be highly compact. Of course, districts with naturally squiggly borders (e.g., due to serpentine coastlines) would end up with a large perimeter length. We accounted for that in our analysis by using official district shapes that included water area.
Are districts drawn by partisan interests less compact?
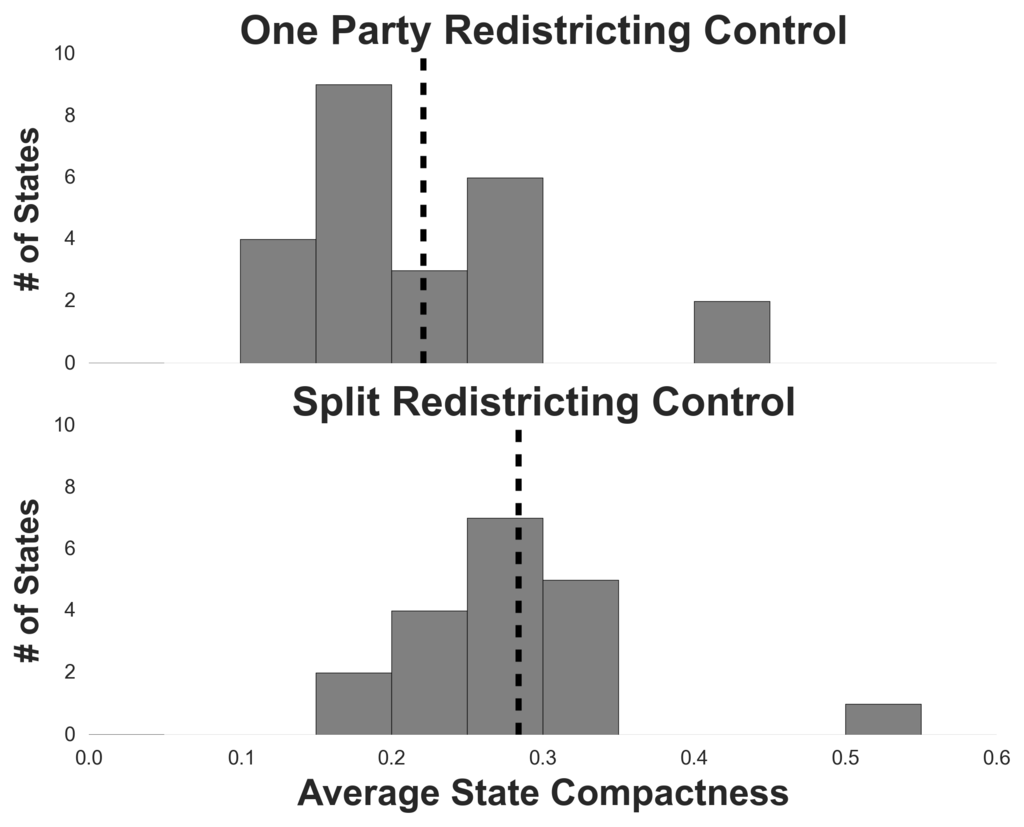 In evaluating Stewart’s hypothesis, we wanted to explore whether district compactness has any relationship with redistricting control. Is it possible that states with legislative control of the redistricting process have less compact (more squiggly) districts, under the assumption that they are strategically shaping districts to win more seats, while those with bipartisan or independent control of the redistricting process are more compact?
We compared the compactness of districts in states with partisan redistricting control to the compactness of districts in states with non-partisan redistricting methods (excluding the seven states with only one district) and found that if the redistricting is controlled by one party, the districts are more gerrymandered as defined by this spatial measure.6
Gerrymandering Score
Given the relationship between voter distribution, compactness, and redistricting controls, we wanted to create a way to identify states that are gerrymandered so we could evaluate the rest of Stewart’s hypothesis. We defined a state to be gerrymandered if the party controlling the redistricting process has packed and cracked the opponent party’s voters across districts.7 To measure this, we created a gerrymandering score for each state based on voter proportions for Democrats and Republicans. We added the number of packed districts (where one party received between 75% and 100% of votes) and cracked districts (where the same party received between 35% and 50% of votes) separately for the two parties, and took the difference. A state with skewed districts will have a higher score. We then labeled the state as being gerrymandered if it satisfied three criteria: (1) it had a score of three or more; (2) the resulting score favors the party in control of redistricting; and (3) the controlling party holds two or more seats than expected.8 There is no single definition of gerrymandering and this is not a perfect classification by any means (e.g., real cracking is difficult to detect), but it does a decent job judging from examples of gerrymandering cited in the news.
 Using this technique, the following states were identified as gerrymandered based on our score: MI, AL, TX, SC, PA, OH, VA, NC, IN, FL.
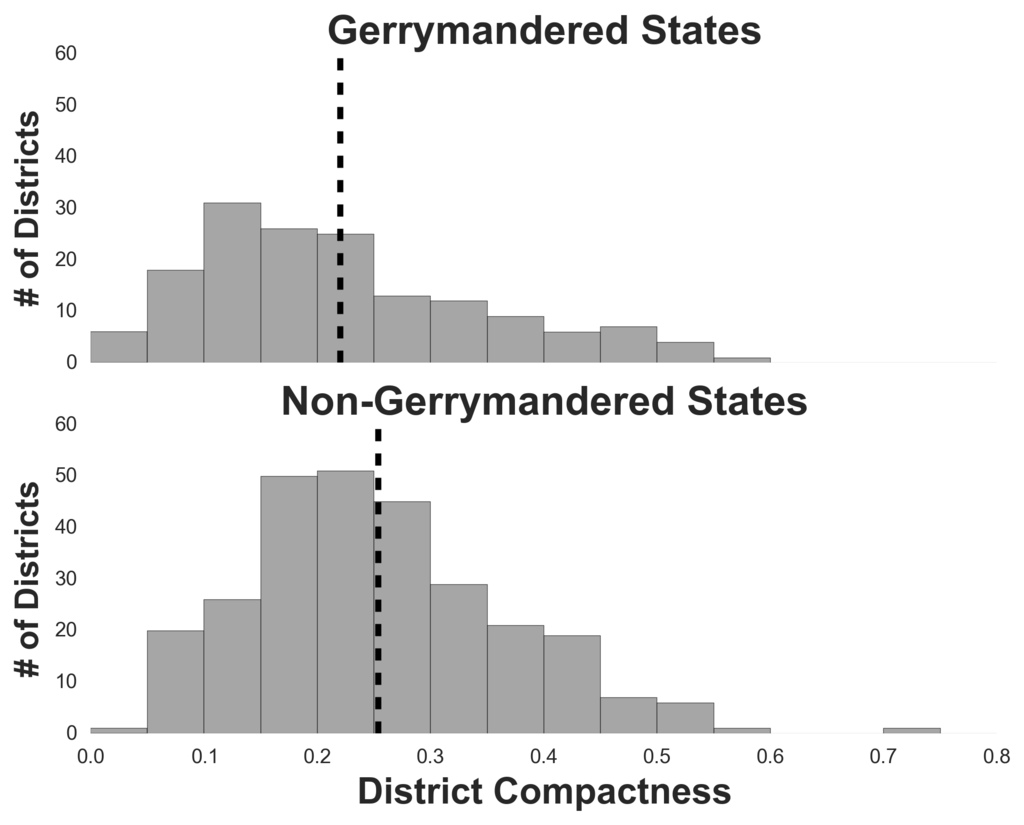
So, is there a relationship between each state’s gerrymander score and the compactness of its districts? Does compactness correlate with packed-and-cracked districts? As it turns out: yes, the districts in gerrymandered states are less compact (more squiggly) than those in non-gerrymandered states.9 This means that our measure correlates with the spatial properties of gerrymandering.
District Partisanship
Satisfied that compactness seems to correlate with the motivation for drawing districts, we next examined how compactness relates to the demographics of a district. Does a less compact district tend to have a more partisan electorate?
We used the Partisan Voting Index (PVI), a score of party leaning compiled by the Cook Political Report. PVI is a measure of how often people in a district voted for a Democratic or Republican candidate in the last two presidential elections relative to the national average. To be clear, PVI simply measures how skewed the distribution of voters is between the two parties; it does not measure where voters fall on an ideological spectrum.
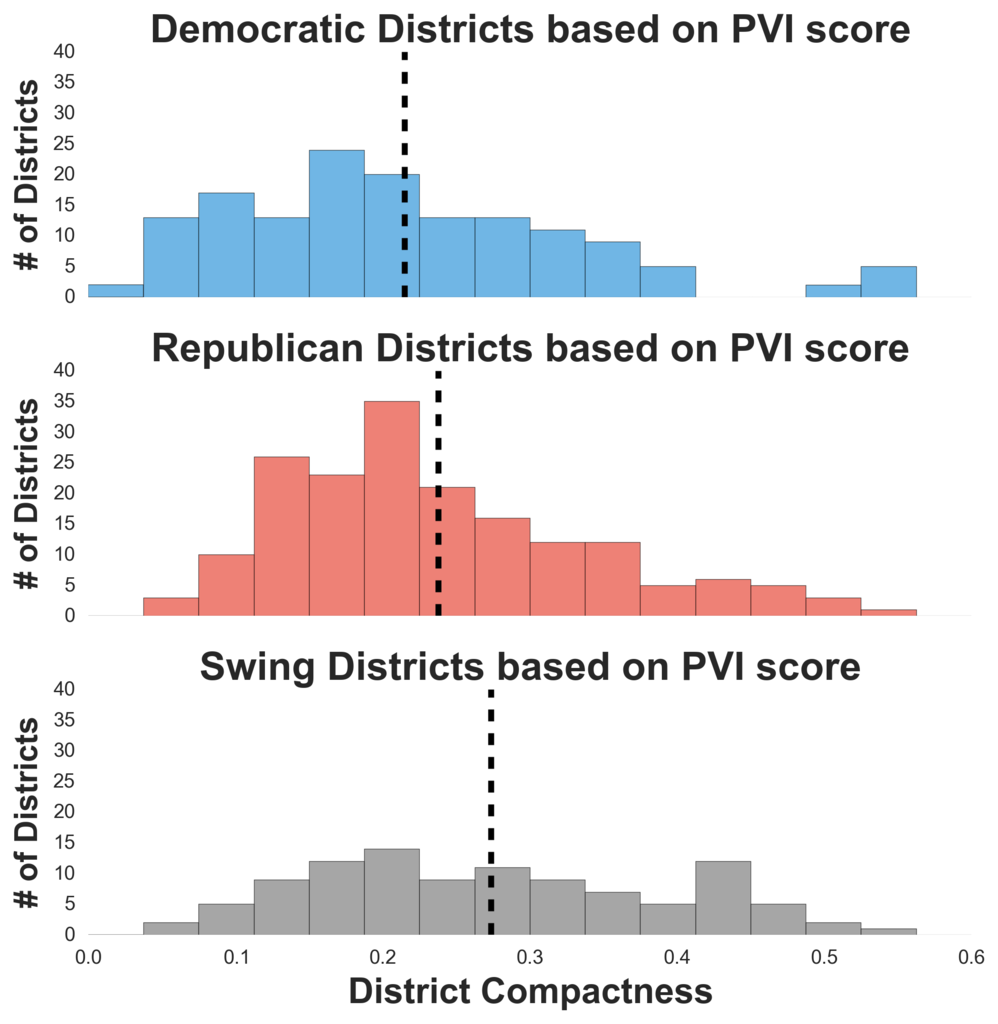
We were interested to determine whether there was any relationship between PVI and compactness. Furthermore, we wanted to examine whether the compactness of districts with skewed voter distributions differ from those with even voter distributions. To do so, we divided the districts into three groups based on the PVI measure: Democratic,10 Republican,11 and swing.12 Our results showed that there is significant difference in averages across all three groups.13Pairwise comparisons revealed that districts that lean heavily toward one party have a lower compactness score on average compared to those that have a balance between the two parties.14 In fact, Democratic districts had the smallest average compactness, following by Republican and swing districts. This implies that these skewed voting districts are gerrymandered (the opposite party may be packed into the oddly shaped district).
Political Ideology
 While we can observe voter preference based on the PVI, we cannot say anything about how polarised a particular representative is. Furthermore, based on recent work by the Brookings Institution, House representatives predominantly vote based on the party line. This behavior dilutes the observability of the real ideological preferences of members of Congress, making their voting records an unreliable measure of ideological extremity.
Another indicator of where representatives fall on an ideological spectrum is where they get their funding. It seems reasonable that those who donate to a candidate’s campaign would share the same stance on issues or point of view. For this information, we relied on the CFscore measures of ideology for representatives in the 2012 elections15 from The Database on Ideology, Money in Politics, and Elections16 (DIME). This is an ideological score on a liberal to conservative spectrum given to representatives based on the financial contributions they receive.17
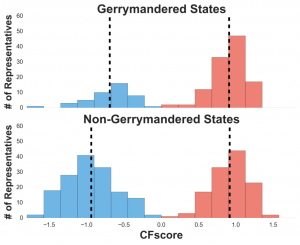 To test the hypothesis that gerrymandering leads to ideologically extreme candidates, we split the districts into two groups based on whether they are part of a gerrymandered state, as defined earlier. We found that gerrymandering does not contribute to the election of politically extreme representatives. We actually see that liberal representatives in gerrymandered states are less ideologically extreme than their counterparts in non-gerrymandered states.18
Conclusion (So, who does Congress really represent?)
To recap, we found that districts are less compact (more squiggly) when one party controls the redistricting process. The congressional districts in gerrymandered states are less compact than those states that are not gerrymandered, as we defined a gerrymandered state for the purposes of this analysis. The electorates in less compact districts tend to be overly skewed towards one party, providing some validation that the motivation of drawing these districts is to achieve specific distributions of voters. However, gerrymandering does not appear to contribute to the election of politically extreme representatives.
Returning to Stewart’s hypothesis, was The Daily Show’s assessment right? We have come some way towards confirming that gerrymandering leads to partisan congressional districts. It’s not clear that the electorate in those districts in turn elect ideologically extreme representatives. However, the relative safety of these districts may discourage their representatives from compromise, leading to gridlock and shutdowns. So a qualified “yes” would seem to be in order. Is gerrymandering to blame for all of Congress’s dysfunction? Probably not, but it is probably a significant contributing factor to much of the dysfunction, in that gerrymandering creates relatively safe districts for everyone in Congress.
The most surprising insight from our analysis was the extent to which gerrymandering has been successfully used by both parties to thwart the the idea of democracy! Partisan control of redistricting has lead to parties gaining an “unfair” number of seats in House delegations. Democrats in North Carolina and Republicans in Massachusetts are right to feel disenfranchised. It seems one thing that Democrats and Republicans can agree on is that, given the opportunity to undermine democracy for partisan advantage, they are keen to do so. In cycle of census and redistricting, it appears Republicans have been more successful in gerrymandering, leading to an exaggerated majority in the house for the GOP. Several lawsuits over this crop of districts are ongoing, and the Supreme Court just ruled on a couple of those cases.
Gerrymandering is a complex issue that doesn’t have an objectively correct solution. While there have been impressive attempts to optimize the drawing of congressional districts with software, algorithms, and the creation of additional independent committees, there is no consensus on the best way to define district boundaries.
One thing is clear: it is the governed that are paying the price for the current system with a House of Representatives we all seem to agree we don’t like. As envisioned by our founding fathers, a healthy democracy depends on citizens that take an interest and hold the political class accountable. Gerrymandering has turned congress into a group of representatives that choose their voters, which inverts the intent of American democracy and make holding the political class accountable difficult.
To further explore how gerrymandering affects the House of Representatives, use our interactive visualization.
1. For simplicity’s sake, we’re going to work with Democrats and Republicans and ignore third-party candidates.↩
2. For example, if a state has 10 seats and 60% of its voters selected a Republican candidate, it would be assigned six Republican seats.↩
3. This was recently detailed by the Washington Post.↩
4. District 9’s Republican candidate had no challenger, which is why they received 100% of the votes.↩
5. Polsby, Daniel D., and Robert D. Popper. “Third Criterion: Compactness as a Procedural Safeguard against Partisan Gerrymandering, The.” Yale L. & Pol’y Rev. 9 (1991): 301.↩
6. For the statistically versed: an independent samples t-test showed that states with one party legislative control of redistricting (n=24, Mean Compactness = 0.22) have lower average compactness than those with split or independent committees (n=19, Mean Compactness = 0.28) [t(41) = 3.13, p < .005].↩
7. We limited the analysis to only states with more than three districts, as well as only districts with both a Democrat and Republican running in the general election.↩
8. For example, in North Carolina two districts are packed with Democrats (1, 12), nine districts contain the cracked Democrats (2, 3, 5, 6, 8, 9, 10, 11, 13), and there are no districts where Republicans are packed or cracked. This results in a score of 11, well above our threshold.↩
9. [t(433) = 3.17, p < .005]↩
10. PVI greater than D+5↩
11. PVI greater than R+5↩
12. PVI between D+5 and R+5↩
13. ANOVA adjusted for multiple comparisons: p < .0005↩
14. t-tests: p < .05↩
15. Bonica, Adam. 2014. “Mapping the Ideological Marketplace”. American Journal of Political Science, 58 (2): 367-387. (Available at http://onlinelibrary.wiley.com/doi/10.1111/ajps.12062/abstract)↩
16. Bonica, Adam. 2013. Database on Ideology, Money in Politics, and Elections: Public version 1.0 [Computer file]. Stanford, CA: Stanford University Libraries. ‹http://data.stanford.edu/dime›.↩
17. We found discrepancies in the database regarding 2012 election winners and fixed them to the best of our ability, particularly making sure that the winner of each district was labeled as such.↩
18. [t(196) = 4.26, p < .00005)]↩